.png?width=700&auto=webp&quality=80&disable=upscale)
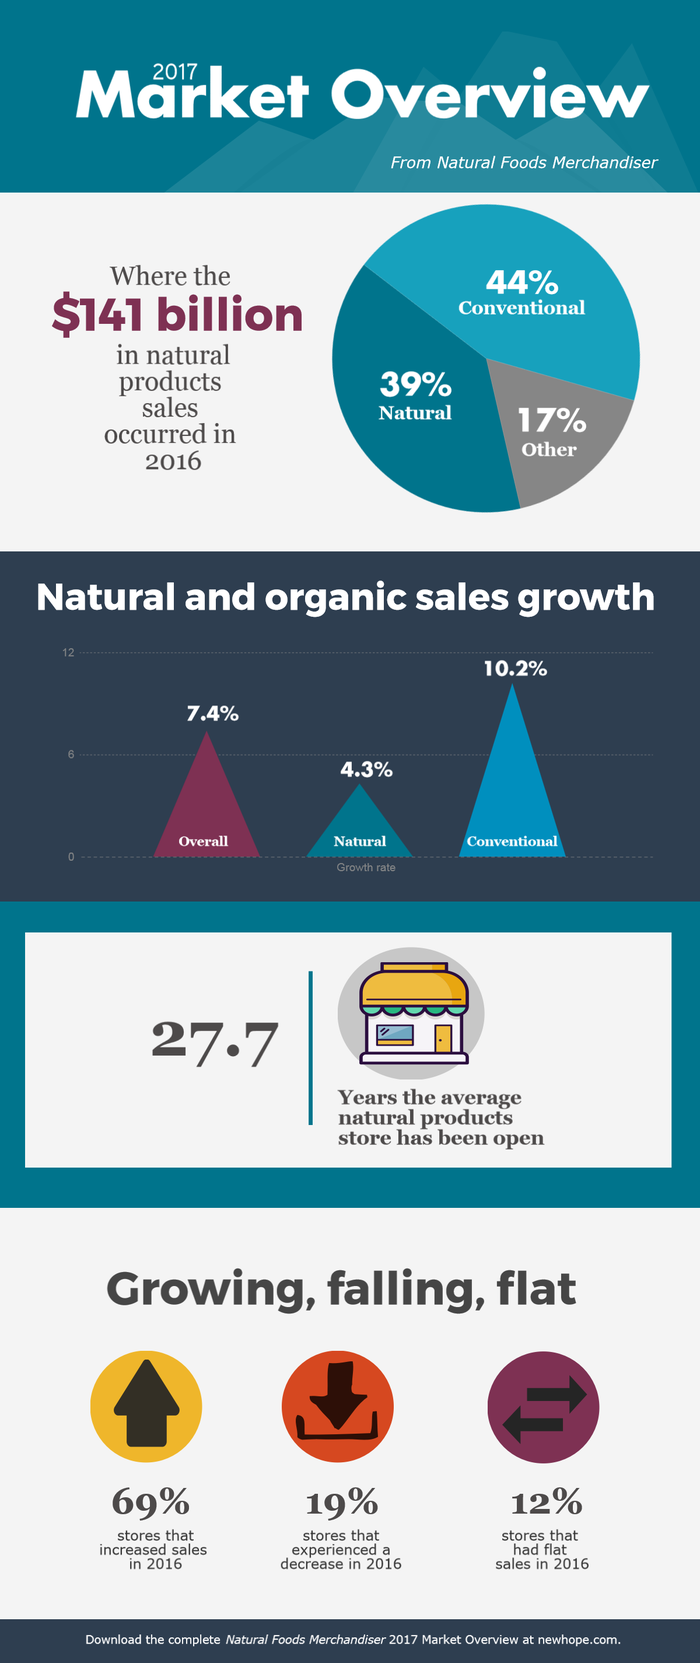
Market Overview: Sizing up 2016 organic and natural products retail sales [infographic]
As the natural and organic market matures, growth slows overall and for independent natural retailers. Review top-level numbers from the annual Natural Foods Merchandiser 2017 Market Overview report in this infographic and download the complete report below.
![Market Overview: Sizing up 2016 organic and natural products retail sales [infographic] Market Overview: Sizing up 2016 organic and natural products retail sales [infographic]](https://eu-images.contentstack.com/v3/assets/blt09e5e63517a16184/blteb24d3b117cd9f2b/64d7196e15c78f28817a8513/mov-story-promo_7.jpg?width=850&auto=webp&quality=95&format=jpg&disable=upscale)
The face of the natural products industry is changing as it grows to $141 billion in sales in 2016.
Each year, Natural Foods Merchandiser magazine tracks the trajectory of an industry it measured early on at $1.9 billion in 1980. The annual report dives into market-size numbers and benchmark data for the industry as well as by store types including supplement stores, health food stores and natural products stores.
Scroll down to the bottom of this infographic to download the annual report with all of the data charts.
Be sure to read the analysis, too, as we look at:


About the Author(s)
You May Also Like


