The natural products industry navigated a tricky 2022, with a wide range of pandemic-related hangovers—labor shortages, inflation, supply chain challenges and evolving consumer shopping habits—affecting the commercial landscape in ways that were, and remain, hard to predict. The fast-changing retail environment forced stakeholders to be nimble and lead with grit, and it’s paying off. Despite the wilderness of volatility and uncertainty, the industry still grew at a rate of 4.7%, which is down from 5.5% in 2021, but aligns with pre-COVID, 2019 industry growth of 4.8%.
While the overall expansion may represent so much “back to normal,” a close examination of data reveals the industry still is navigating unusually turbulent times: Large natural grocery chains and specialty stores experienced sales dollar growth of 5.6% in 2022, while independent natural retailers and small chains barely budged, with a wan showing of 0.9%. Also, consider that natural and organic food sales rose 4.6% at natural products retailers, but ballooned 7.8% at conventional retailers.
Click download, below, for the charts related to this story.
E-commerce slows
Remember the rapid rise of e-commerce during COVID? Online retail channels saw huge sales gains in 2020 and 2021. Now, consumers are spending more time roaming brick-and-mortar aisles, chatting with sales associates, sniffing pineapples and reading labels—and devoting less time to e-commerce. In fact, the growth of e-commerce sales in the natural channel hovered at just 5.6% in 2022, a stark contrast to the 23.2% jump in 2021 and 69.1% the year before that.
In short, the deeper we explore the myriad retail niches and channels within the overall industry, the more we unearth granular details about trends that matter to the people who own and run stores in the quickly evolving natural products industry.
The commercial landscape remains complex and fluid, as so many factors—the dramatic rise of remote working, increased attention to wellness, inflation and shifting consumer behavior—continue to influence where people shop and what they buy. In this assessment of last year in the natural products industry, we examine areas that experienced the most change, while spotlighting where the status quo reigned. One topic we explore is the degree to which inflation, rather than increases in unit sales, drove 2022’s growth in sales receipts.
The analysis offers plenty of bright lights, along with dark corners. One hopeful note: Optimism for the year to come remains about as strong as it was in last year’s Market Overview report. Of those surveyed in 2021, 53% predicted that sales growth in 2022 would be stronger than it had been in the previous year, and the same percentage of respondents currently expect 2023 sales growth to be stronger than last year.

Organic boosts traditional categories
From the 2022 data, the overall trajectory for the natural and organic products industry looks advantageous. Food sales always dominate with brick-and-mortar retailers, last year accounting for 62% of sales. And growth in food outpaced the overall industry. Another bright spot was organic food sales, which experienced 4.6% growth last year—a healthy boost from 2021’s post pantry-stocking paltry expansion of 0.9%.
Some of the biggest movement between 2021 and 2022 within the natural and organic food industry revolved not around trendy new innovations, but old-school categories. Both traditional dairy and meat—but with twists hinging on agricultural practices such as regenerative and organic—performed quite well across 2022 in natural products stores.
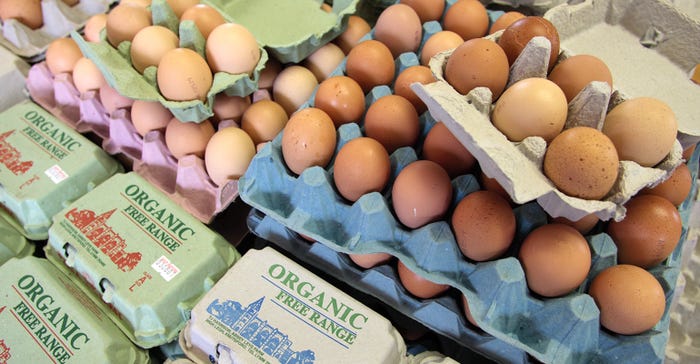
Dairy appeared to experience a 2022 renaissance, with sales hikes of 6.2% compared to a 1.1% decline in 2021. But organic dairy, with its 8.9% increase in sales dollars in 2022, boosted dairy’s overall growth. Similarly, meat, fish and poultry sales overall grew 6.4% in 2022, but sales of organic versions of these products experienced a 10.5% lift. While inflation drove growth last year, increased interest in regenerative agriculture and environmental concerns are heightening consumer interest in these categories.
Snacks, too, have returned: The category expanded 5.4% in 2022 compared to 2.8% in 2021, as consumers ventured out and about again and demand for on-the-go foods resurged. Further, the snack category’s pursuit of angles that resonate with consumers, from incorporating upcycled foods into chips to launching popcorn flooded with global flavors, helped stoke its bounce.
Meals made easier
Another category enjoying mounting momentum is packaged and prepared foods. While its 2.2% growth does not match growth of food overall, it represents a welcome improvement over 2021, when sales fell 2.2%. The trendline is even more impressive when we consider organic prepared food sales in 2022, which rose by 3.4%. In 2021, those sales dipped 9%.
Increased sales of packaged and prepared foods in 2022 speak in part to the evolution of both pantry and frozen meals. While both categories long ago began branching away from old-school mainstays such as kits for making Tex-Mex-style tacos, conventional macaroni and cheese and frozen pizza, innovation in this category increases every year. Global flavors rule. Now look for packages to make Nigerian jollof rice, tacos al pastor or frozen bibimbap.
Editor's note:
The 2023 edition of Natural Foods Merchandiser’s Market Overview represents the 43rd year the magazine has presented statistics on store operations and the state of the natural products industry.
The primary vehicle for collecting data for the Market Overview is NFM’s annual natural retail store survey. This survey was distributed to a representative segment of the natural products retail industry, including, but not limited to, natural products stores, health food stores and supplement stores. Approximately 230 respondents from various independent retailers reported the results of their calendar year 2022 operations. We are pleased that this is the strongest response we’ve had since the pandemic; however, the number of responses remains lower than historical averages because labor and supply shortages continue to disrupt the market and divert retailers' resources.
Total product category sales and organic sales figures were derived from statistical analysis of survey results across natural products retailer categories.
Data on mass-market sales and other sales channels are derived from several sources. In addition to the NFM survey, retail and consumer sales data is also compiled from Nutrition Business Journal market estimates, U.S. government sources, SPINS, IRI, NielsenIQ, public company financial data, surveys published by other trade publications and other sources.
For charts and more data regarding sales by channel, sales growth and organic sales, click download.
About the Author(s)
You May Also Like
.png?width=700&auto=webp&quality=80&disable=upscale)


