1 Min Read
![Sales and growth across the supplement supply chain [infographic] Sales and growth across the supplement supply chain [infographic]](https://eu-images.contentstack.com/v3/assets/blt09e5e63517a16184/bltfe088ecb7a247f10/64d6c8454af14b7dfd28fa65/supplement-raw-materials_0.jpg?width=850&auto=webp&quality=95&format=jpg&disable=upscale)
humonia/iStock/Getty Images Plus
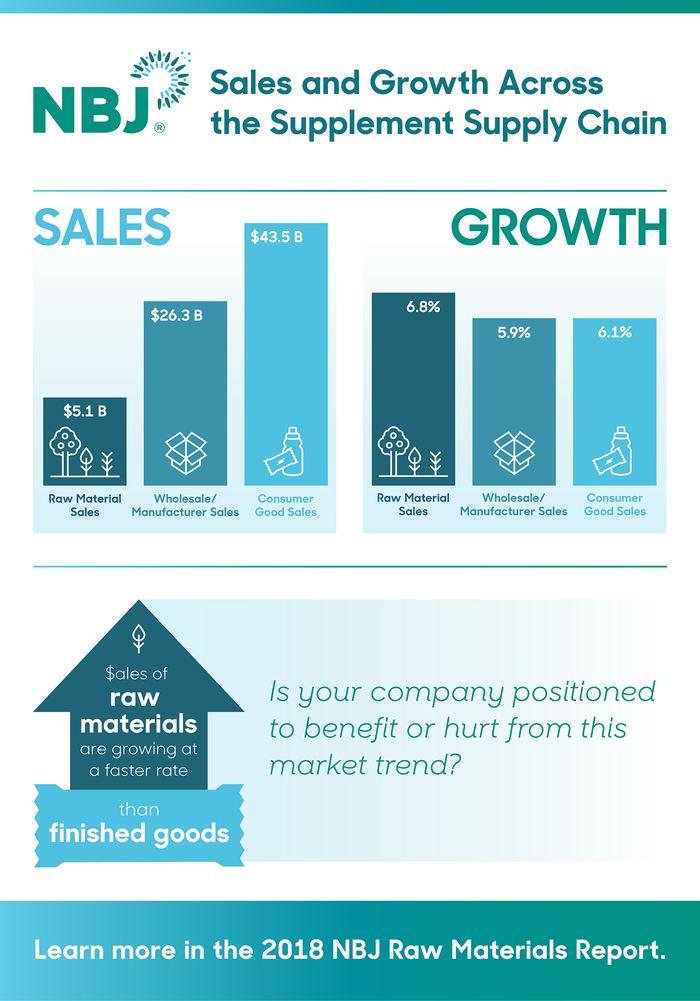
Raw material sales in 2017 grew at a faster rate than finished goods. If you're producing a raw ingredient or component used in the supplement market, it's important to understand the characters and components in the space. With the 2018 Raw Materials Report, that becomes possible.
Download some charts from the report below, and get the full report to position your company for growth within the supplement supply chain.

Download the top charts from the 2018 Raw Materials Report:
About the Author(s)
Subscribe and receive the latest updates on trends, data, events and more.
Join 57,000+ members of the natural products community.
You May Also Like


