June 23, 2022

When I recently spoke with a natural products retailer, she mentioned that the oft-repeated idea that things would one day “get back to normal” was absurd. I couldn’t agree more.
This phrase, along with its equally trite companion “the new normal,” grates on me—not only for its banality, but also because it gives no credit to how far we’ve come over the past few years. What counts is how we’ve managed, how we’ve evolved and even how we’ve triumphed in heretofore unthinkable circumstances, and how we continue to do so.
Forward is the word I choose to cling to. Moving forward is our path and the only way to go about our business and daily lives in the constantly evolving state we’re experiencing.
Retailers know this only too well after adapting to a radically changing market that began during the peak of the pandemic in 2020 and continued through the rollercoaster ride that also was 2021. Supply chain struggles, safety concerns, staffing issues, masks on/masks off…a constant state of flux. But you don’t need me to tell you this.
The 2021 NFM Market Overview reflects some of these ups and downs, although, as with last year’s survey, the data set we had to work with was less robust than it was in pre-COVID years. Once again, we are focusing on natural product stores, natural food stores and supplement stores.
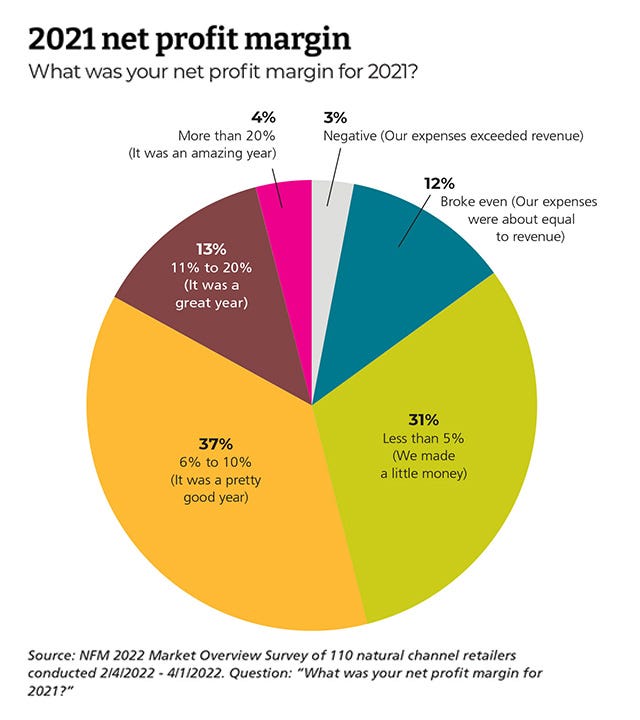
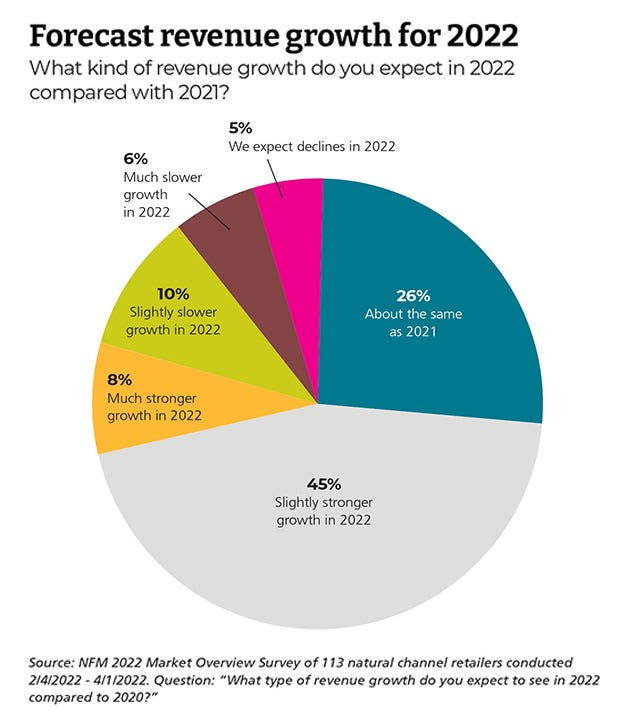
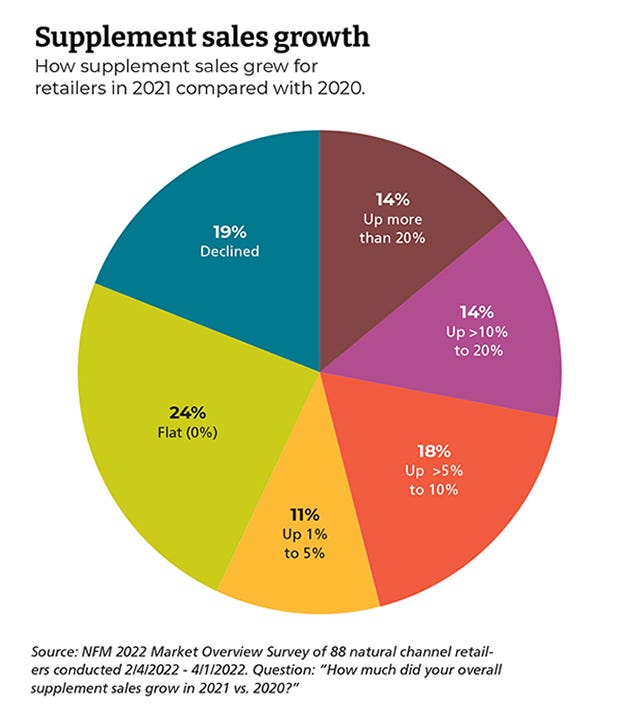
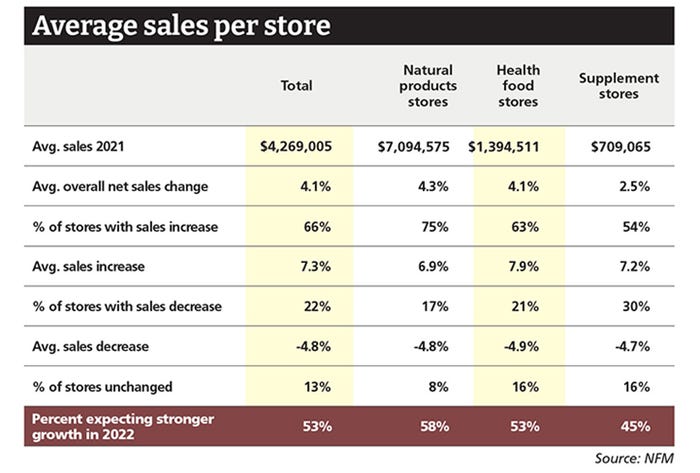
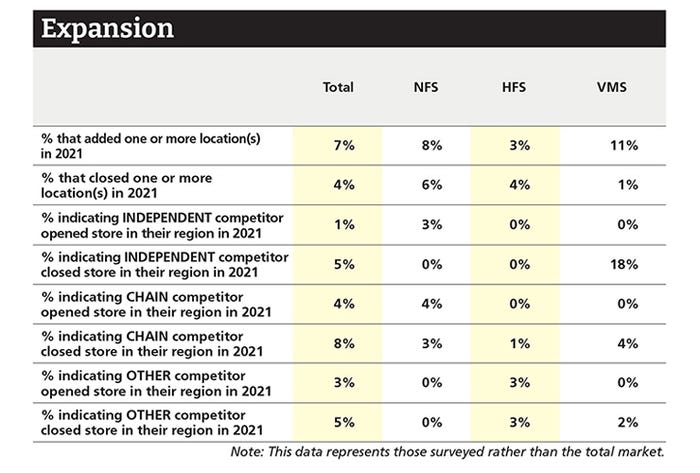
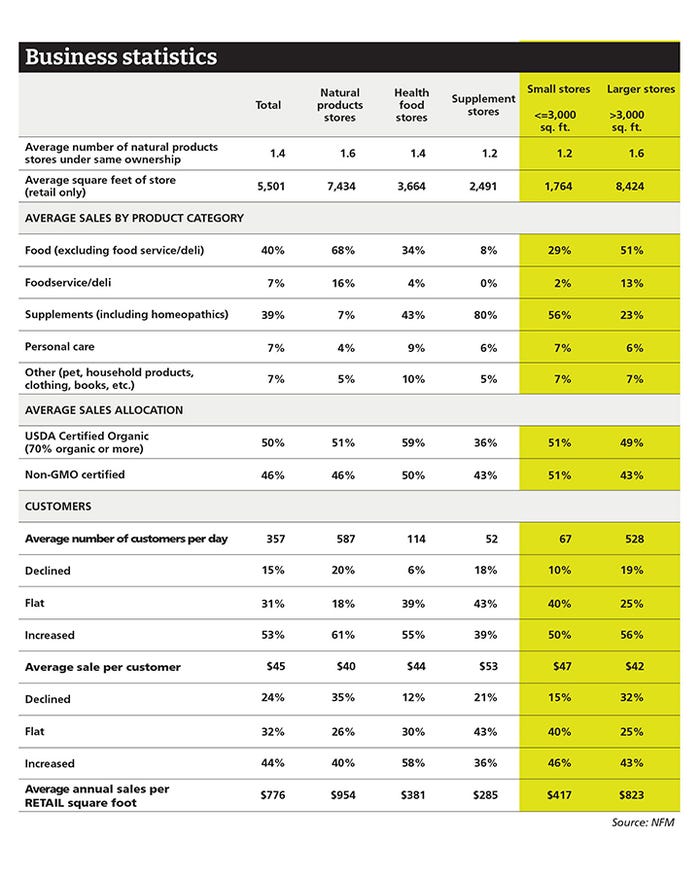
Some bright spots from our survey: Retailers continued to open stores, sales continued to grow and profit margins were decent. Store traffic increased for the majority of retailers after a slowdown during the pandemic, but basket size hasn’t declined since the rise seen during 2020. — Adrienne Smith, director of content, New Hope Network
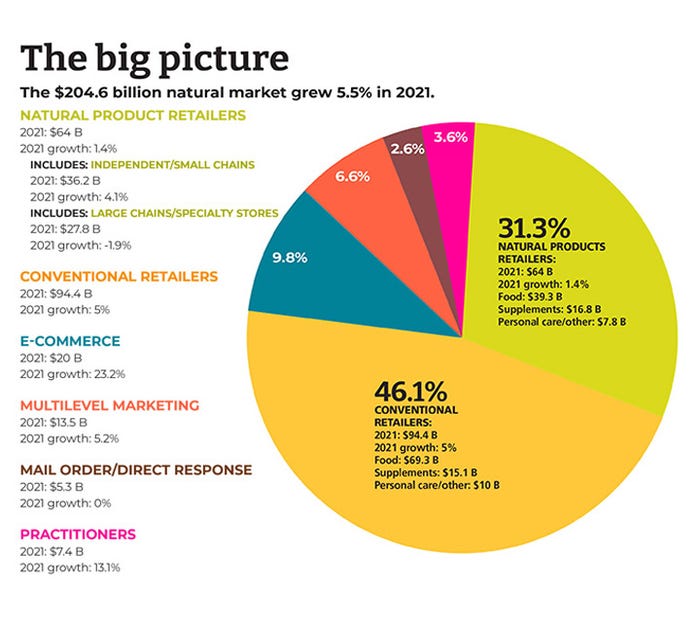
Store category definitions
Natural products stores—These stores make 60% or more of their revenue from food. They are typically the largest stores in the market and offer a wide array of products from supplements and body care to groceries, to cold and frozen, to produce. Many stores in this category also have large pet product sections and household sections. Foodservice (bakery and deli departments) are common, as well.
Health food stores—These stores receive more than 20% of their sales from food and more than 50% of their sales from food and supplements combined. Normally they are smaller than natural products stores. While they have grocery, cold and frozen sections, in addition to supplements and body care, the sections are probably smaller. If they have produce, it is more likely to be a modest offering.
Supplement stores—As this title indicates, these stores focus on supplements, with at least 60% of their sales from supplements and less than 20% of sales from food. Their dominant product offering is supplements, usually with some body care and possibly a small grocery (drinks and snacks) offering. They are also the smallest stores in terms of retail space.
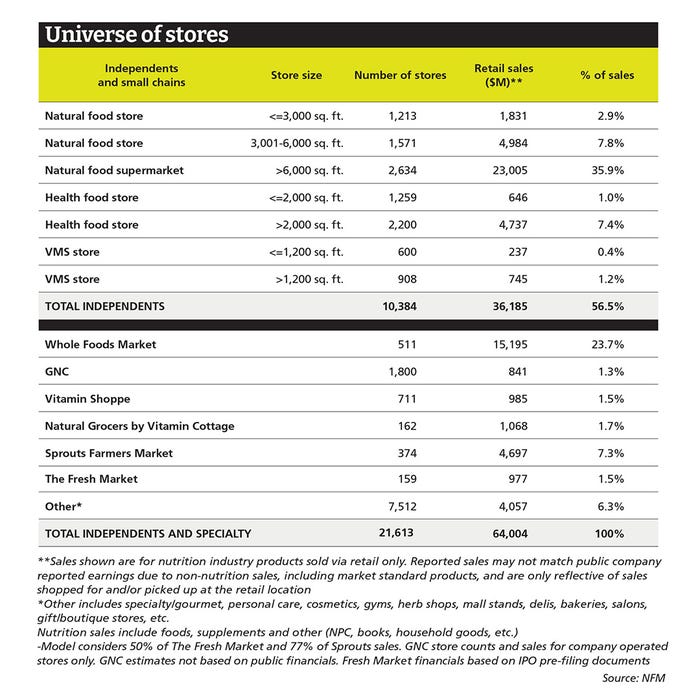
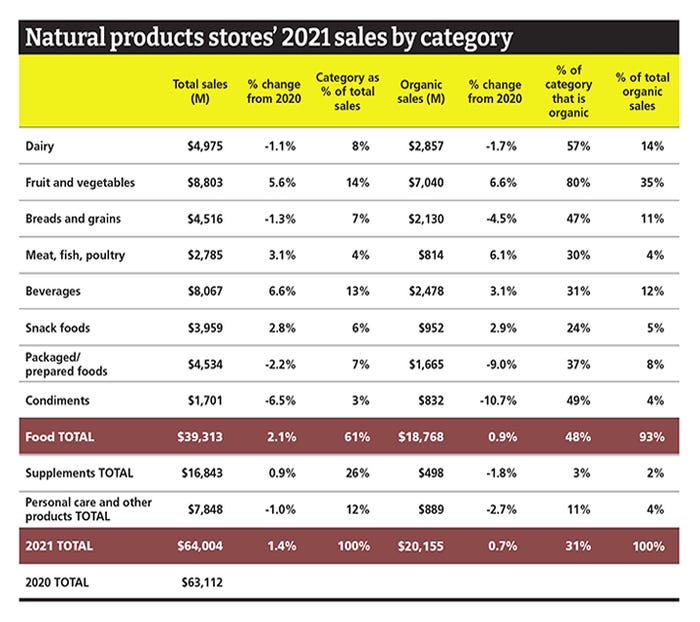
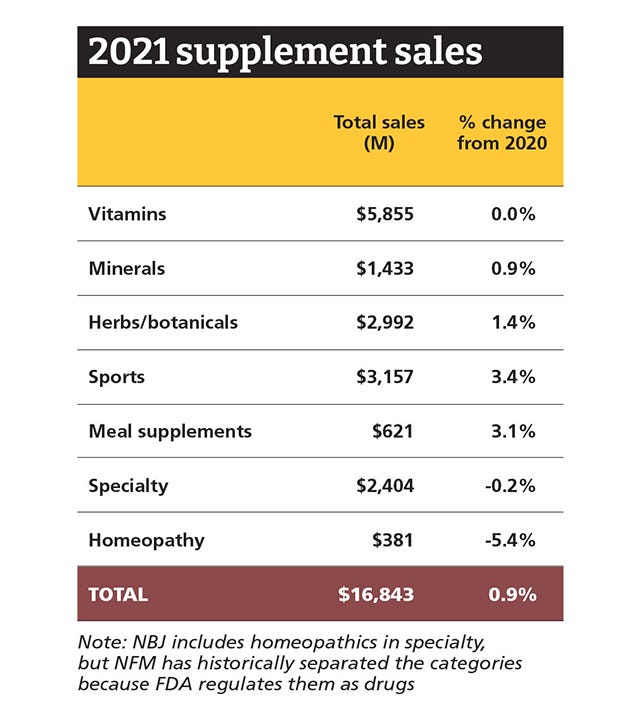
Methodology
The 2022 edition of Natural Foods Merchandiser’s Market Overview represents the 42nd year the magazine has presented statistics on store operations and the state of the natural products industry.
The primary vehicle for collecting data for the Market Overview is NFM’s annual natural retail store survey. This survey was distributed to a representative segment of the natural products retail industry, including, but not limited to, natural products stores, health food stores and supplement stores. Approximately 140 respondents from various independent retailers reported the results of their calendar year 2021 operations. While pleased with the results, ultimately the number of respondents completing the survey this year was lower than normal because of the continued diversion of retailer resources due to an economy where labor and supply shortages continue to cause market disruptions.
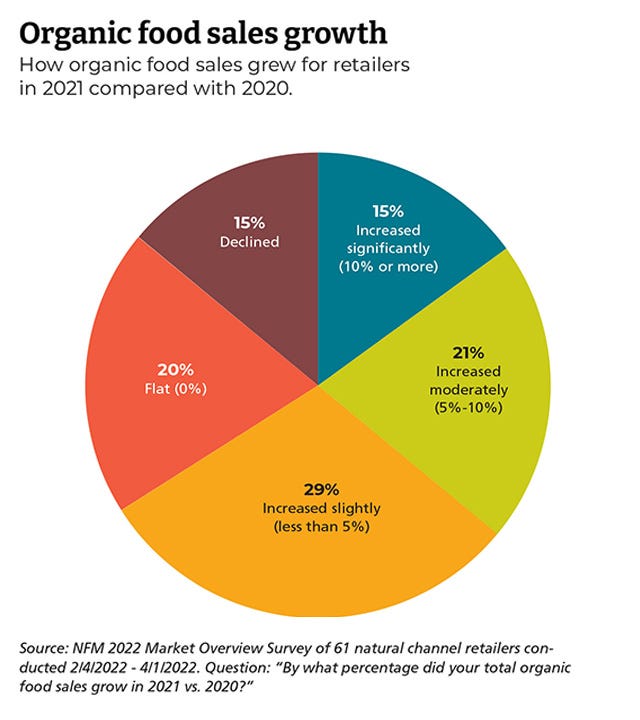
Total product category sales and organic sales figures were derived from statistical analysis of survey results across natural products retailer categories.
Data on mass-market sales and other sales channels are derived from several sources. In addition to the NFM survey, retail and consumer sales data is also compiled from Nurition Business Journal market estimates, U.S. government sources, SPINS, IRI (a Chicago, Illinois-based market research firm), NielsenIQ, public companies' financial data, surveys published by other trade publications and other sources.
About the Author(s)
You May Also Like
.png?width=700&auto=webp&quality=80&disable=upscale)
