August 24, 2021

How big is the natural products retail market?
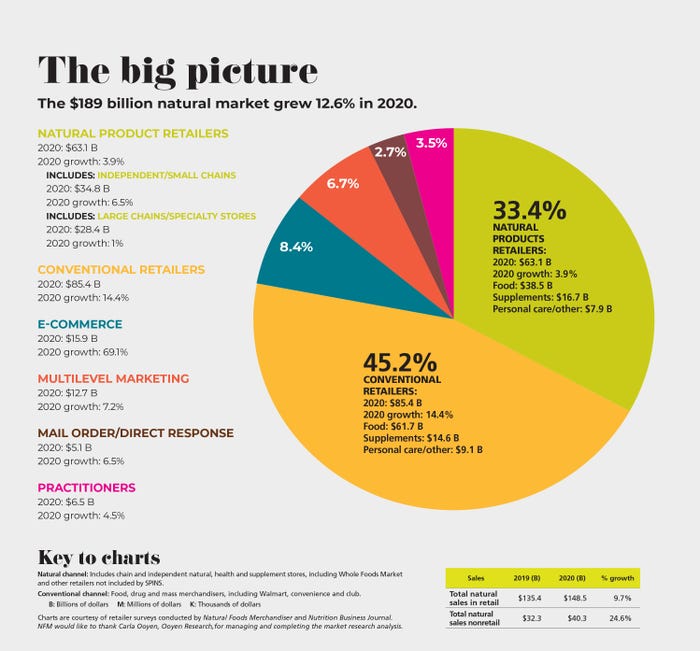
With overall natural retail sales hitting $189 billion in 2020, this pie chart shows just where natural and organic product sales occurred and how they grew.
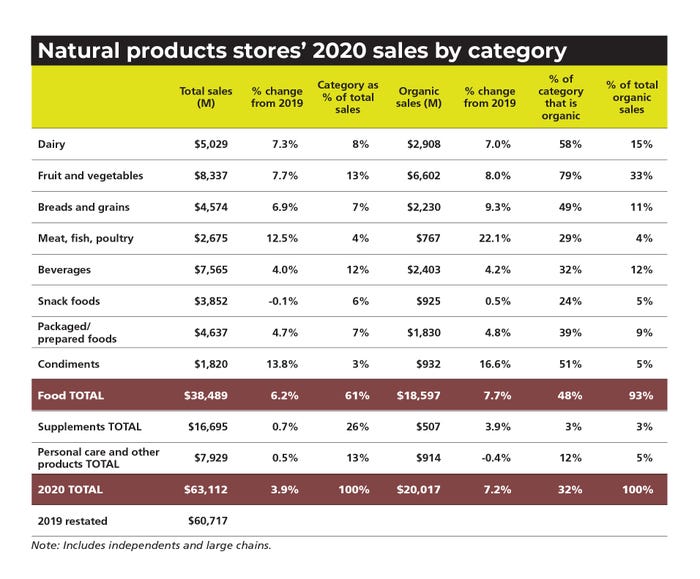
How did natural and organic products sales grow in the natural channel in 2020?
Condiments and meat led category growth rates in the natural channel, with organic meat, fish and poultry experiencing the greatest growth rate.
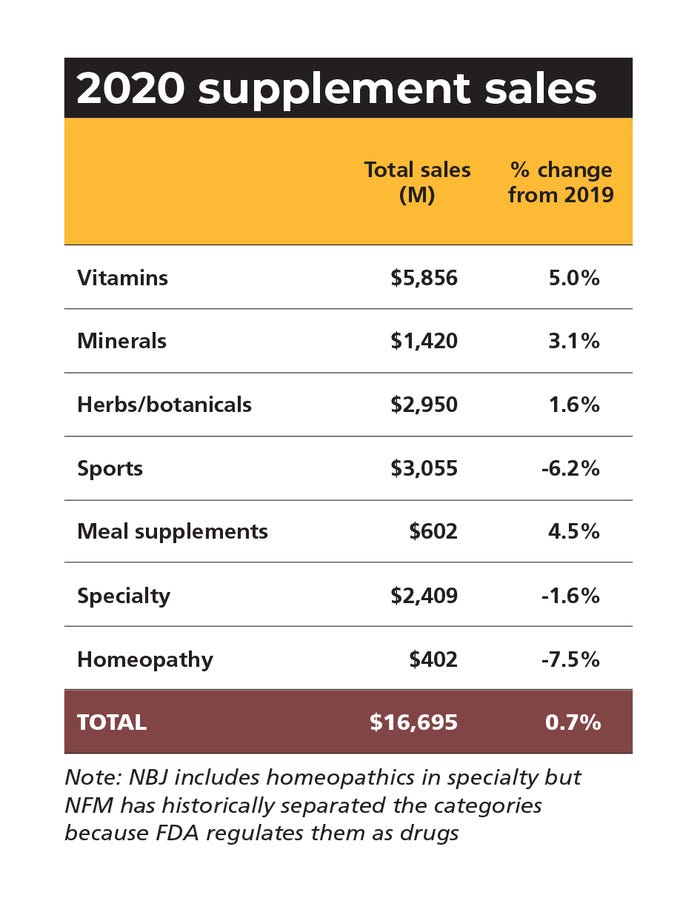
How did supplements sell at natural in 2020?
Vitamin sales took the top growth spot in 2020 with the COVID-19 pandemic inspiring consumers to focus on fundamental health. Meanwhile, sports supplements, a bright spot just a year earlier, took a hit as consumers stayed home.
Natural Foods Merchandiser's natural retail store definitions
Natural products stores
These stores make 60% or more of their revenue from food. They are typically the largest stores in the market and offer a wide array of products from supplements and body care to groceries, to cold and frozen, to produce. Many stores in this category also have large pet product sections and household sections. Foodservice (bakery and deli departments) are common, as well.
Health food stores
These stores receive more than 20% of their sales from food and more than 50% of their sales from food and supplements combined. Normally they are smaller than natural products stores; and while they have grocery, cold and frozen sections, in addition to supplements and body care, the sections are probably smaller. If they have produce, it is more likely to be a modest offering.
Supplement stores
As this title indicates, these stores focus on supplements, with at least 60% of their sales from supplements and less than 20% of sales from food. Their dominant product offering is supplements, usually with some body care and possibly a small grocery (drinks and snacks) offering. They are also the smallest stores in terms of retail space.
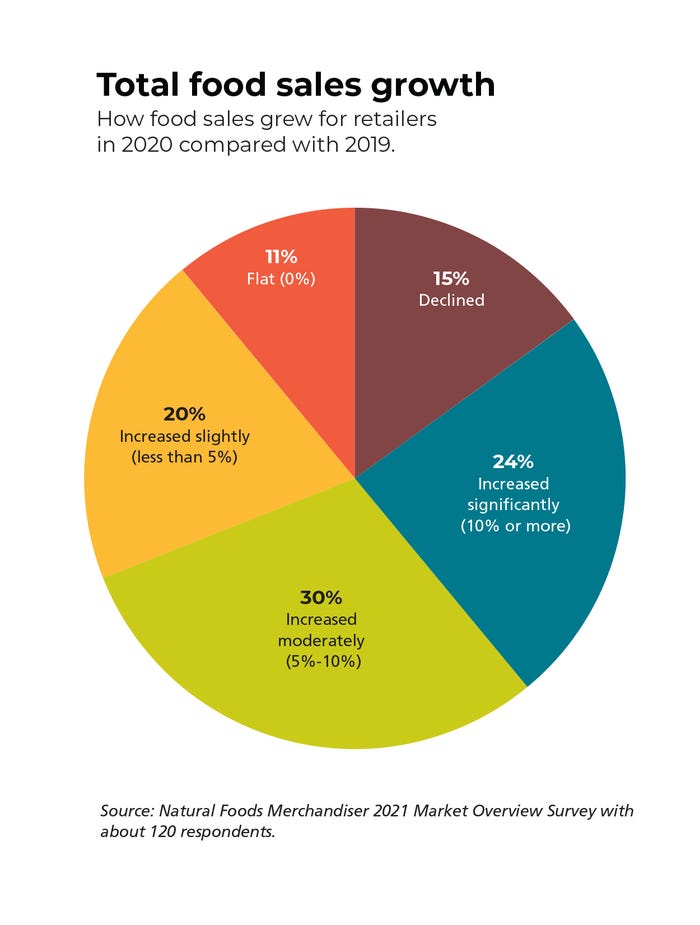
How did food sales grow in the natural channel in 2020?
Here's how natural products retailers said 2020 food sales compared with 2019. Most experienced moderate and significant growth as consumers cooked more meals at home and adopted baking hobbies.
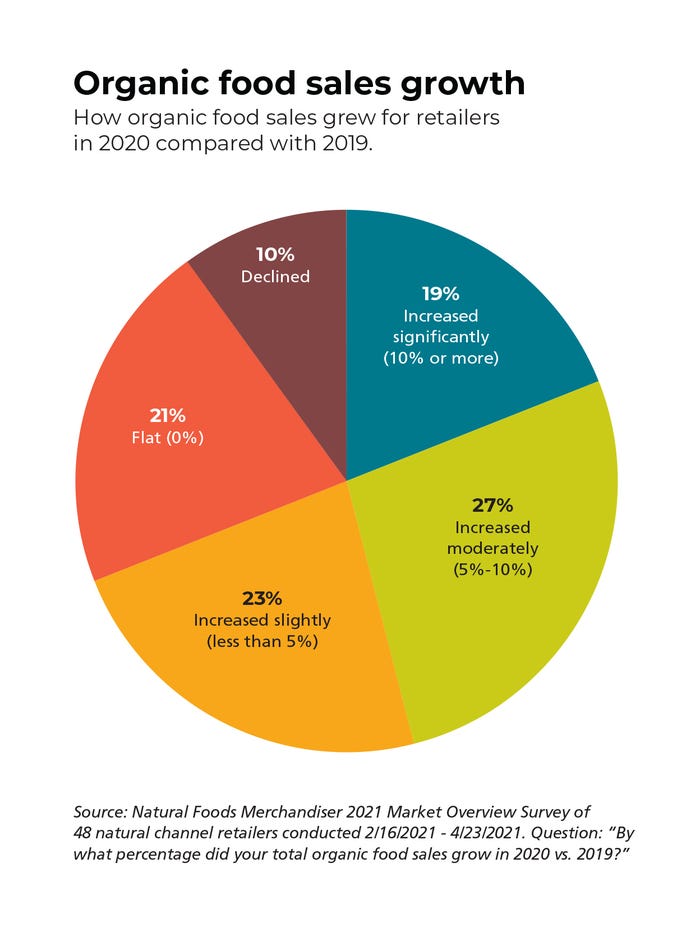
How did organic food sales grow in the natural channel in 2020?
Here's how natural products retailers said 2020 food sales compared with 2019. Most experienced moderate growth.
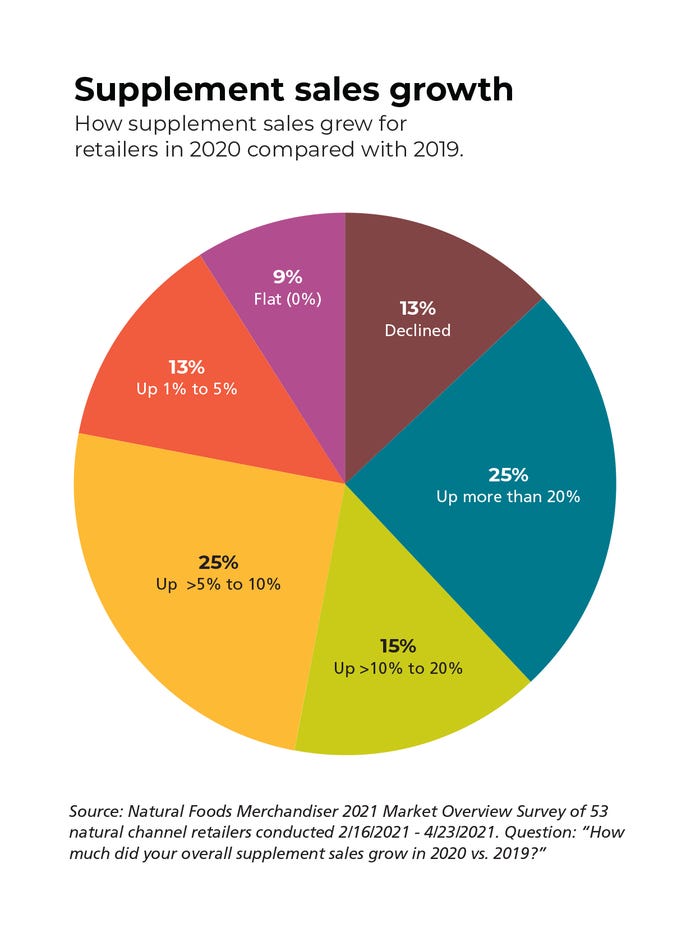
How much did supplement sales grow for natural products retailers in 2020?
Here's how natural products retailers said 2020 supplement sales compared with 2019. One-fourth of retailers experienced growth of more than 20 percent.
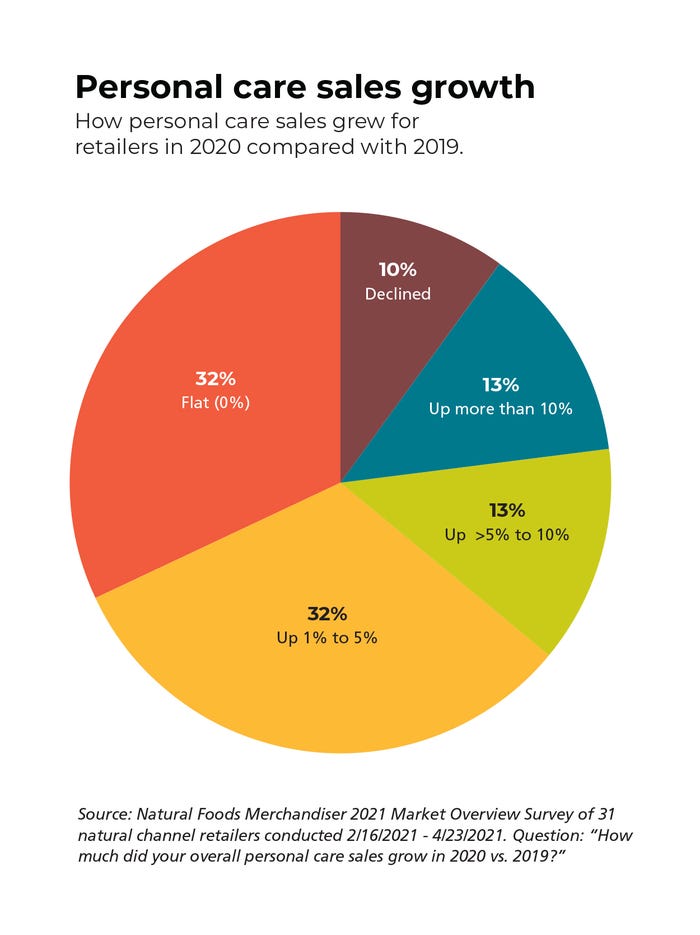
How did natural and organic personal care sales fare in 2020?
A majority of natural channel retailers reported their personal care product sales were flat or up 1-5% from 2019 to 2020, according to the 2020 Natural Foods Merchandiser Market Overview Survey.
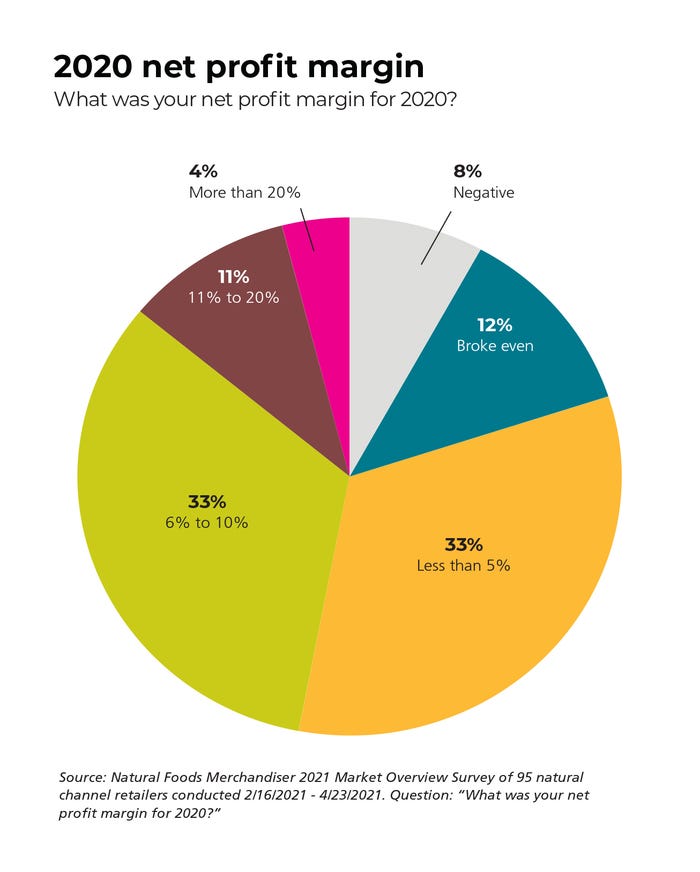
What's the average profit margin for a natural food store?
One-third of natural products retailers had a net profit margin from 6 to 10% in 2020.
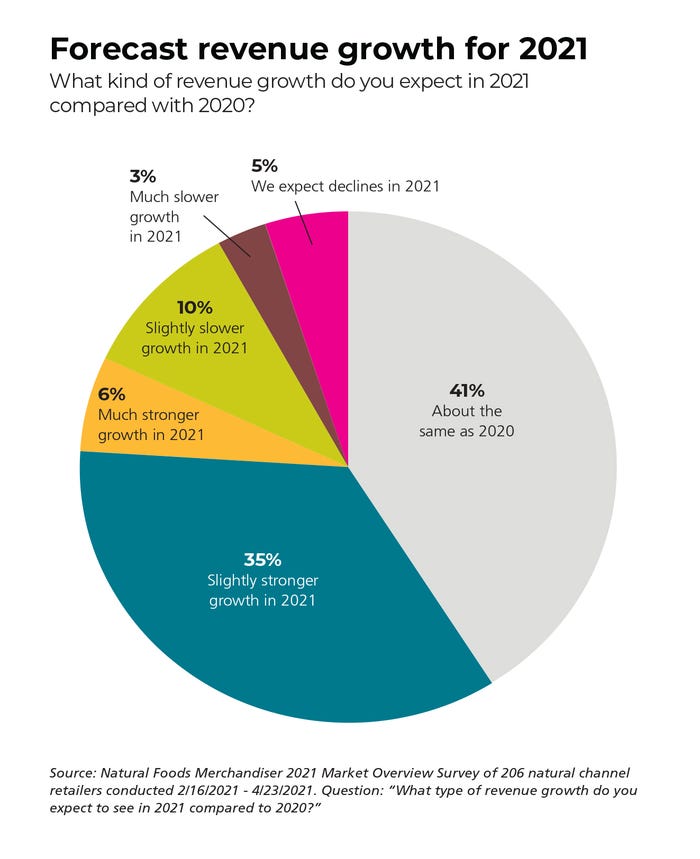
How is natural retail expected to grow in 2021?
Natural products retailers predict their 2021 sales will remain about the same as 2020 (41%) with 35% expecting slightly stronger growth.
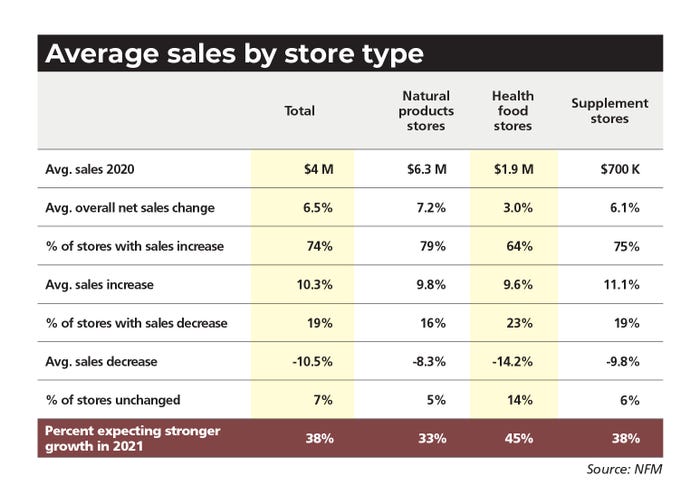
How much does the average health food store sell each year?
Find sales benchmarking data across natural products retailers below. Traditional health food stores averaged $1.9 million in sales in 2020.
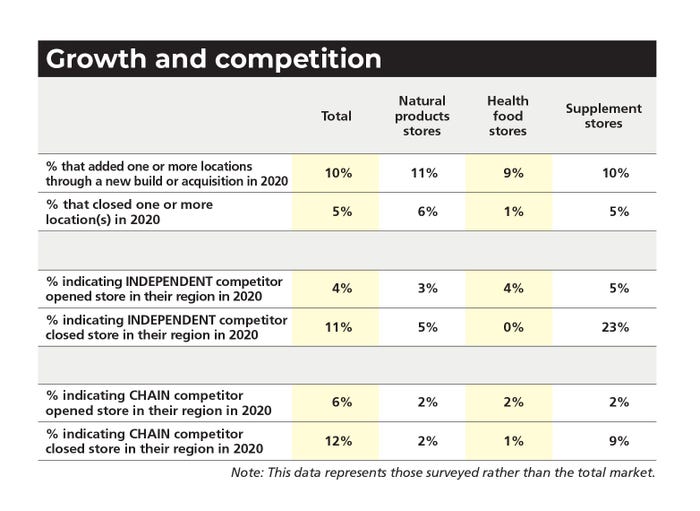
What did growth and competition look like for natural products retailers in 2019?
Natural retail competition continues to grow, with 20% of retailers saying a competitor opened a store in their region.
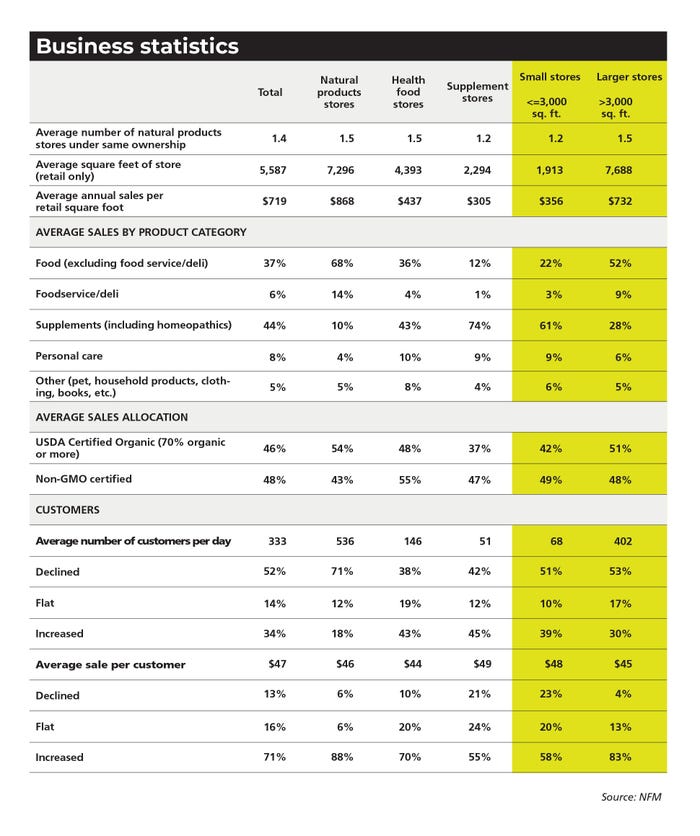
What is the average sales per square foot at natural channel retail?
Below find several important natural retail benchmarks of note.
How many natural products retail outlets are there?
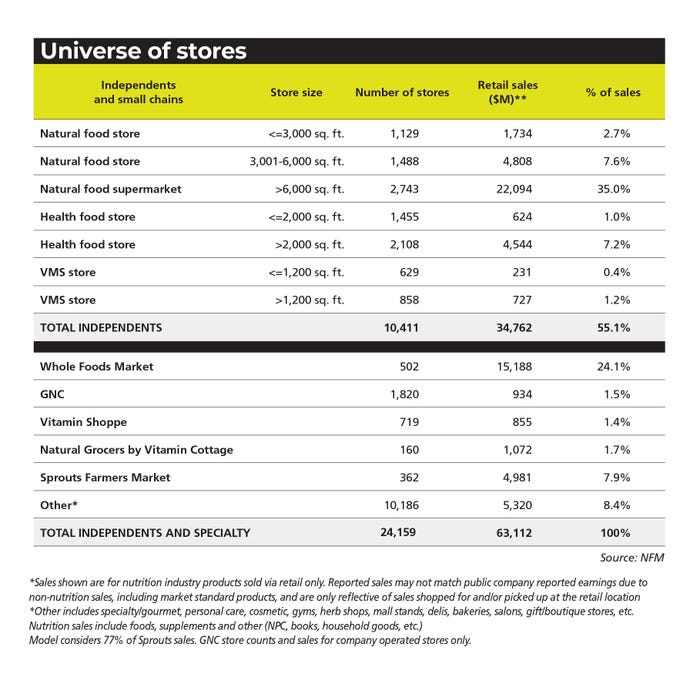
The Natural Foods Merchandiser magazine "universe of stores" chart breaks down the number of stores by kind of natural product retail outlet.
Natural Foods Merchandiser Market Overview methodology
The 2021 edition of Natural Foods Merchandiser’s Market Overview represents the 41st year the magazine has presented statistics on store operations and the state of the natural products industry.
The primary vehicle for collecting data for the Market Overview is NFM’s annual natural retail store survey. This survey was distributed to a representative segment of the natural products retail industry, including, but not limited to, natural products stores, health food stores and supplement stores. About 120 respondents from various independent retailers reported the results of their calendar year 2020 operations. While pleased with the results, ultimately the number of respondents completing the survey this year was lower than normal because of the diversion of retailer resources to COVID-19 responses.
Total product category sales and organic sales figures were derived from statistical analysis of survey results across natural products retailer categories.
Data on mass-market sales and other sales channels are derived from several sources. In addition to the NFM survey, retail and consumer sales data is also compiled from NBJ, U.S. government sources, SPINS, IRI (a Chicago-based market research firm), public company financial data, surveys published by other trade publications and other sources.
Data for the mass market and non-retail channels are based on NBJ market estimates.
About the Author
You May Also Like
.png?width=700&auto=webp&quality=80&disable=upscale)


.jpg?width=700&auto=webp&quality=80&disable=upscale)
