US consumers are drinking fewer sweetened beverages
The percentage of heavy sugar-sweetened beverage drinkers trended downwards in most demographic categories, according to a new study.
September 28, 2020

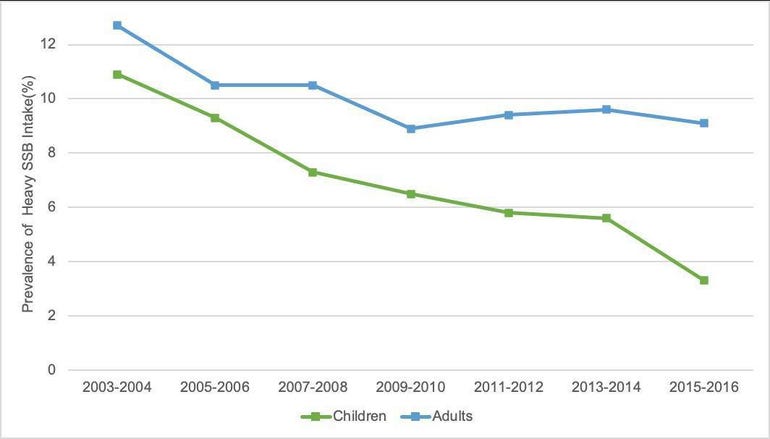
According to a new study, the percentage of heavy sugar-sweetened beverage (SSB) consumers—those who drink more than 500 calories of SSBs daily—trended downwards in the United States between 2003 and 2016. Among children, the percentage of heavy SSB consumers declined from 11% to 3% consistently across age group, sex, family income level and most races/ethnicities. For adults, the percentage of heavy SSB consumers declined from about 13% to 9% overall, but there was variation among different age, sex and racial/ethnic groups.
"Our study contributes important new evidence and insights to research on SSB consumption, and it tells a public health success story. The percentage of children and adults who are heavy sugary beverage drinkers has declined significantly, which is similar to trends in overall SSB consumption. Public health strategies to reduce excessive intake of sugary beverages appear to be working," said senior investigator Sara N. Bleich.
SSBs are widely consumed in the U.S. by about 60% of children and 50% of adults on a typical day, and they represent one of the largest sources of added sugar in the diet. Heavy sugary beverage drinkers are an important group to monitor since excessive intake is linked to chronic conditions like obesity and diabetes as well as cavities. In recent years concern about excessive SSB consumption has been addressed through various strategies. For example, a number of cities and counties have imposed beverage taxes and passed several healthy beverage ordinances requiring restaurants to offer only healthy beverages with children's meals.
Studies looking at the changing consumption of sugary beverages have generally shown declines over the past decade. Unlike this study, however, little of the prior research has concentrated on heavy SSB drinkers, people who consume more than the equivalent of about 3.5 cans of soda daily.
The investigators used data from 2003 to 2016 for a sample of more than 20,000 children and 30,000 adults from the National Health Examination and Nutrition survey (NHANES), which provided a nationally representative look at beverage consumption for adults and children. In addition to looking at changes in consumption over time by heavy SSB consumers overall, the investigators looked at trends by age, sex, race/ethnicity and family income level, as well as purchase and consumption locations.

The results showed that the percentage of heavy SSB drinkers has increased among people 60 years old and older, although the absolute percentage of heavy SSB consumers in this group was low. There was no significant change in the percentage of heavy SSB drinkers (no improvement) over the period among the 40- to 59-year old group and among non-Mexican Hispanic adults, while most other race/ethnicities experienced a decline (improvement). Finally, the investigators looked at the most recent years of data (2015-2016) and found that the majority of SSB calories consumed by heavy SSB drinkers were from stores and about half of the SSB calories were consumed at home.
First author Kelsey A. Vercammen said, "The insights gleaned from our study can help reduce consumption even further. Because the results zeroed in on several groups who showed no improvement or actually increased their intake, these can be used to better target interventions. Ongoing surveillance is also important to keeping these trends moving in the right direction."
Source: The Academy of Nutrition and Dietetics
You May Also Like


