Natural retail growth index shows improvement
June 18, 2013

 June rolls on—and so do the opportunities to analyze information from the latest Market Overview from Natural Foods Merchandiser. As I did in my last post, I want to focus again on relevant overview details. If you don’t have a printed copy, you can download the full Market Overview here.
Also, be sure to join my colleague Christine Kapperman, editor-in-chief of Natural Foods Merchandiser and me for a free, live webinar going over the Market Overview. Dean Nelson, owner of Dean’s Natural Food Market, will also be sharing vital insights. The session is 2 p.m. Eastern Thursday, June 20. You can register here.
Let’s look at how different store types performed last year. We divide stores into three categories:
Defining store types
Natural products stores.
These stores have less than 40 percent of their revenue from supplement sales. They are typically the largest stores in the market and offer a wide array of products from supplements and body care to groceries, to cold and frozen, to produce. Many stores in this category also have large pet product sections and household sections. Foodservice (bakery and deli departments) are common, as well.
Health food stores.
These stores have between 40 percent and 80 percent of their revenue coming from supplement sales. Normally they are smaller than natural products stores; and while they have grocery, cold and frozen sections, in addition to supplements and body care, the sections are probably smaller. If they have produce, it is more likely a modest offering, and they are less likely to have foodservice.
Supplement stores.
As this title indicates, these stores focus on supplements, with at least 80 percent of their sales coming from supplements. Their dominant product offering is supplements, usually with some body care and possibly a small grocery (drinks and snacks) offering. They are also the smallest stores in terms of retail space.
Natural products stores
Natural products stores had a good year with almost 84 percent of them showing an increase, compared with 77 percent last year. Just more than 5 percent of them were down, compared with 6.7 percent last year.
Given the growing consumer acceptance of natural and organic products, along with the effective marketing programs and operational strengths that these stores bring to market, this is not a real surprise. We hear quite frequently about some of the biggest stores in this category—Sprouts, Earth Fare, Natural Grocers by Vitamin Cottage and others.
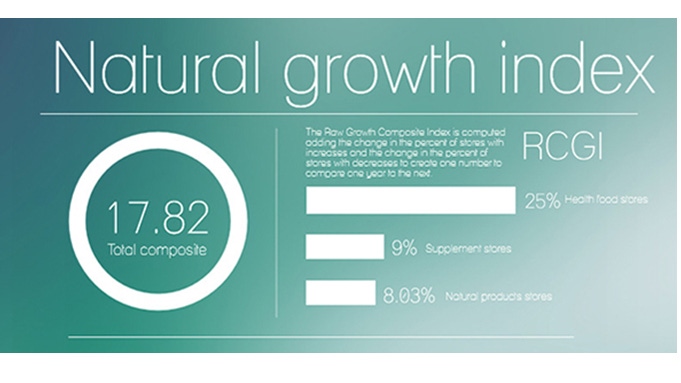
An odd trend in what I call the “Raw Growth Composite Index” surprised me. The RGCI is a number that I compute adding together the change in the percent of stores with increases and the change in the percent of stores with decreases to create one number to compare one year to the next. For this category of stores, this year’s number is 8.03 percent. This is a solid number and might be hard number to beat by a lot going forward as the positives are so high and the negatives are so low, but let’s look at the last four years:
2013 2012 2011 2010
8.03% 0.30% 16.70% 0.20%
This pattern of a good year followed by an almost-flat year jumped out at me. I am curious if market conditions and store outreach are attracting a lot of new shoppers and then they are moving to other formats of stores instead of being retained. (I am already looking forward to next year’s numbers to see how this one looks!)
Health food stores
Health food store data show an amazing year. More than 78 percent of stores were up, compared with just 63 percent last year. As if this change wasn�’t enough, only 7.9 percent of stores had a decrease. It is a bigger number that we’d like to see, but last year this number was more than 17 percent. What a change. The RGCI number for this category is 25 percent—last year it was 3.4 percent.
In fact, if you recall any of my writing or speaking about health food stores last year, I was a bit concerned about them. Natural products stores and supplements stores were both outpacing them. They obviously put my concerns to rest with a performance like this.
Supplement stores
Supplement stores also did quite well. The number of stores with increases came in at 70 percent, a few points ahead of last year. Where they excelled was with stores with decreases. This year was a little over 9 percent which is well down from last year’s 21.4 percent. RGCI came in at 15.7 percent which was a bit above last year’s 13.3 percent.
This category of store is one that always causes some concern to me. As the smallest stores, not only in retail space but also in total revenue, they have the most vulnerability to shifts in the market. They average only three full-time employees and only 18 percent of store owners own their retail space. Twenty-one percent of these stores were flat, neither up nor down in sales, this year. (Last year it was 12 percent.) Hopefully, this is not indicative of trouble to come or a sign that the gains in the other categories of stores came from them picking up customers from the supplement stores instead of adding “new converts” to the natural and organic consumer ranks.
Next post, we’ll explore the effect that e-tailers are having on brick-and-mortar retail stores, as well as the market share struggle between conventional and natural retailers—and a few other tidbits as space permits.
About the Author(s)
You May Also Like


