Market Overview 2020: Natural retail market size and stats
The Natural Foods Merchandiser 2020 Natural Retail Market Overview Survey results are in. Find the retail market sizing and data charts below.
July 10, 2020

How big is the natural retail market?
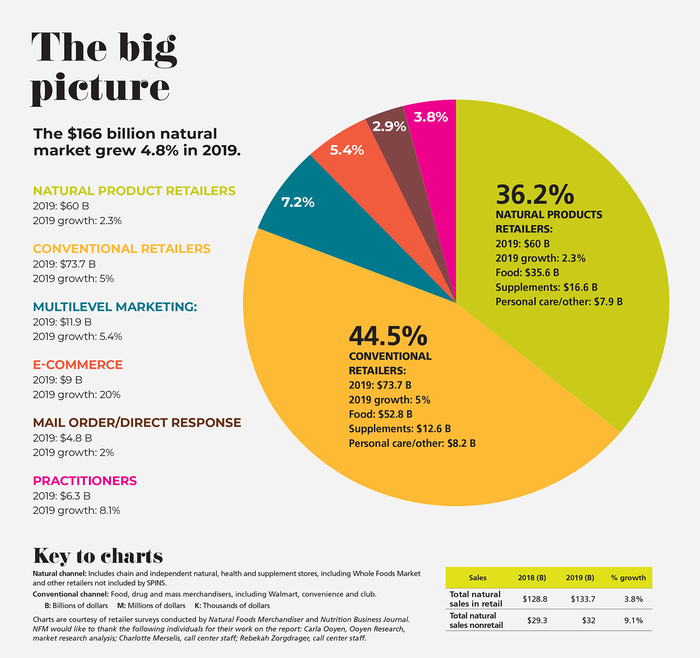
With overall natural retail sales hitting $166 billion in 2019, this pie chart shows just where natural and organic sales occurred and how they grew.
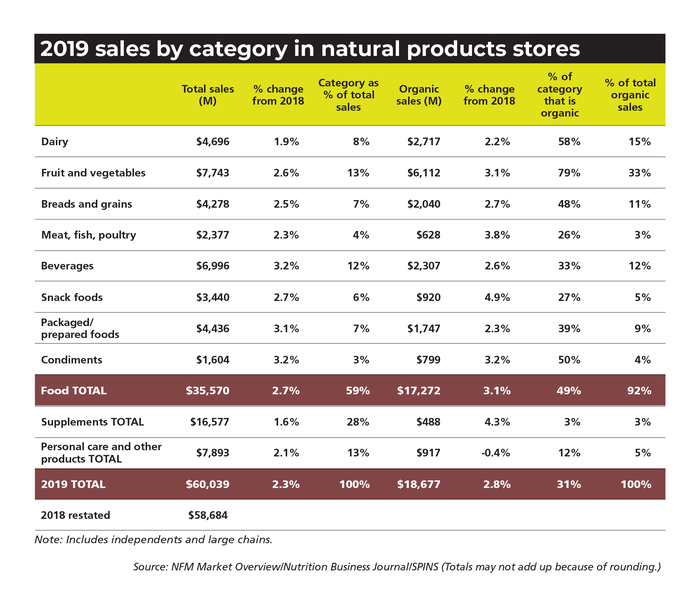
How did natural and organics sales grow in the natural channel in 2019?
Beverage and condiment sales led category growth rates in the natural channel, with organic meat, fish and poultry experiencing the greatest growth rate.
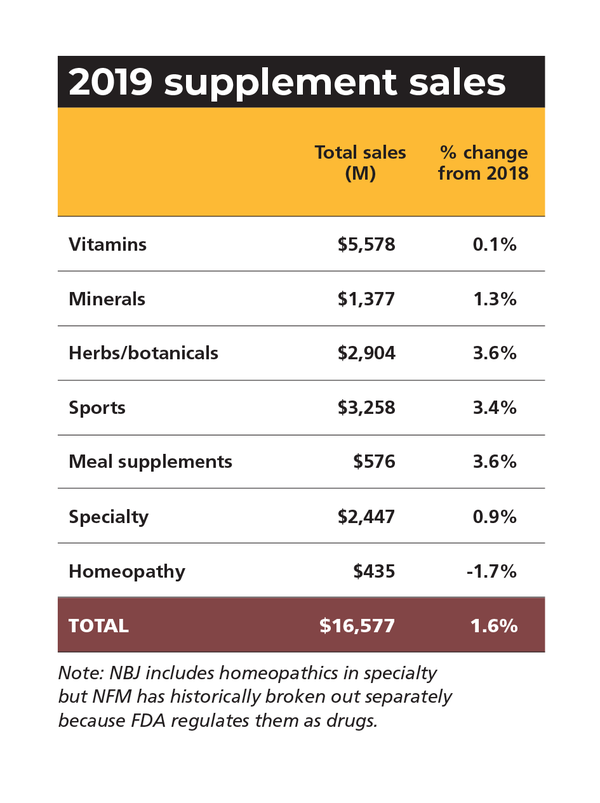
How did supplements sell at natural in 2019?
Herbs and botanicals continued to shine, growing at a 3.6% clip in 2019.
Natural Foods Merchandiser's natural retail store definitions
Natural products stores
These stores make 60% or more of their revenue from food. They are typically the largest stores in the market and offer a wide array of products from supplements and body care to groceries, to cold and frozen, to produce. Many stores in this category also have large pet product sections and household sections. Foodservice (bakery and deli departments) are common, as well.
Health food stores
These stores receive more than 20% of their sales from food and more than 50% of their sales from food and supplements combined. Normally they are smaller than natural products stores; and while they have grocery, cold and frozen sections, in addition to supplements and body care, the sections are probably smaller. If they have produce, it is more likely to be a modest offering.
Supplement stores
As this title indicates, these stores focus on supplements, with at least 60% of their sales from supplements and less than 20% of sales from food. Their dominant product offering is supplements, usually with some body care and possibly a small grocery (drinks and snacks) offering. They are also the smallest stores in terms of retail space.
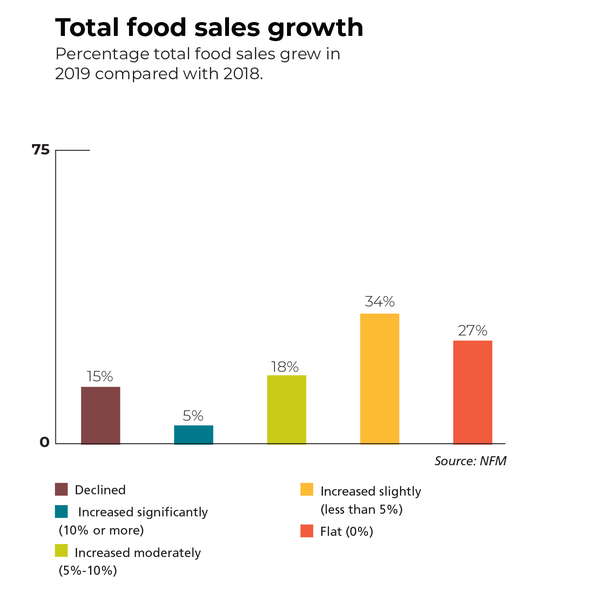
How did food sales grow in the natural channel in 2019?
Here's how natural products retailers said 2019 food sales compared with 2018. Most experienced slight natural and organic sales growth.
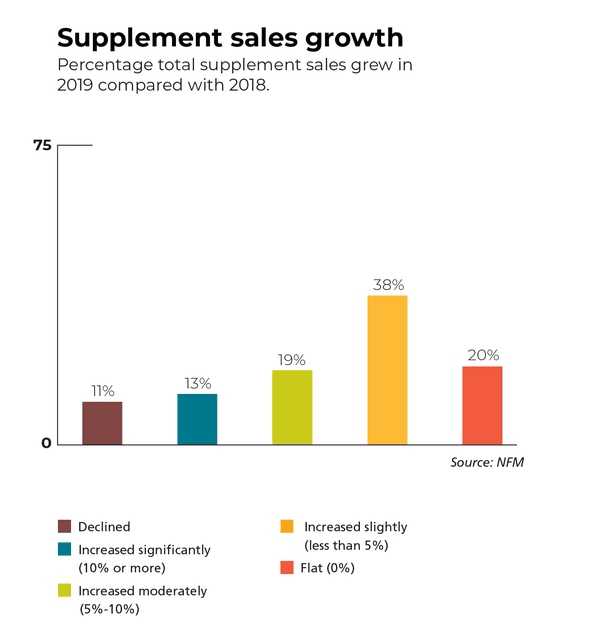
How much did supplement sales grow for natural products retailers in 2019?
Here's how natural products retailers said 2019 supplement sales compared with 2018. Most experienced slight natural and organic sales growth.
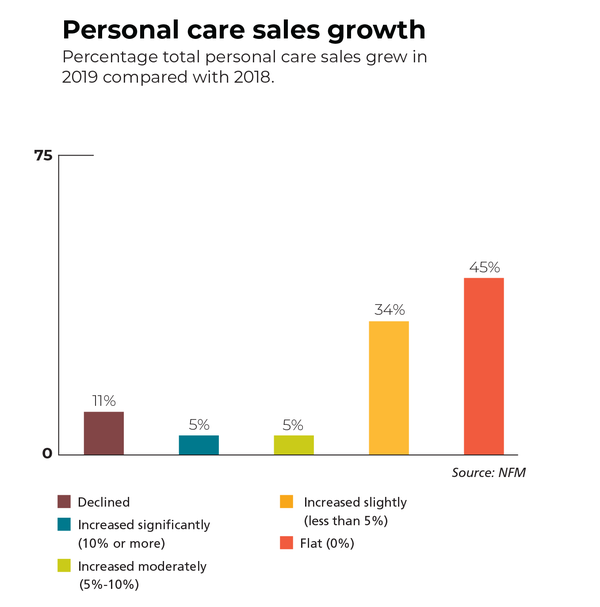
How did natural and organic personal care sales fare in 2019?
A majority of natural channel retailers reported their personal care product sales were flat from 2018 to 2019, according to the 2020 Natural Foods Merchandiser Market Overview Survey.
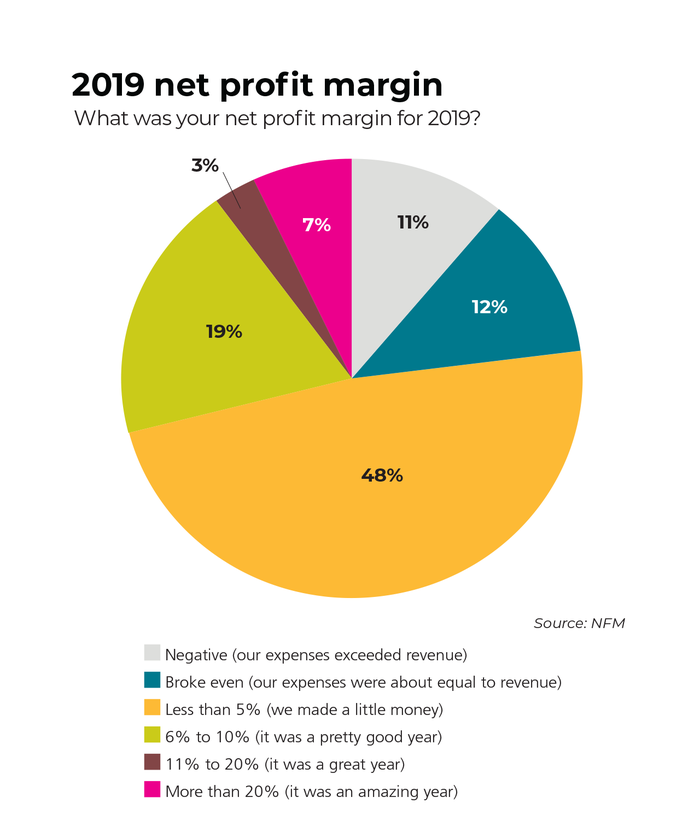
What's the average profit margin for a natural food store?
Almost half of natural products retailers reported their net profit margin for 2019 at less than 5%.
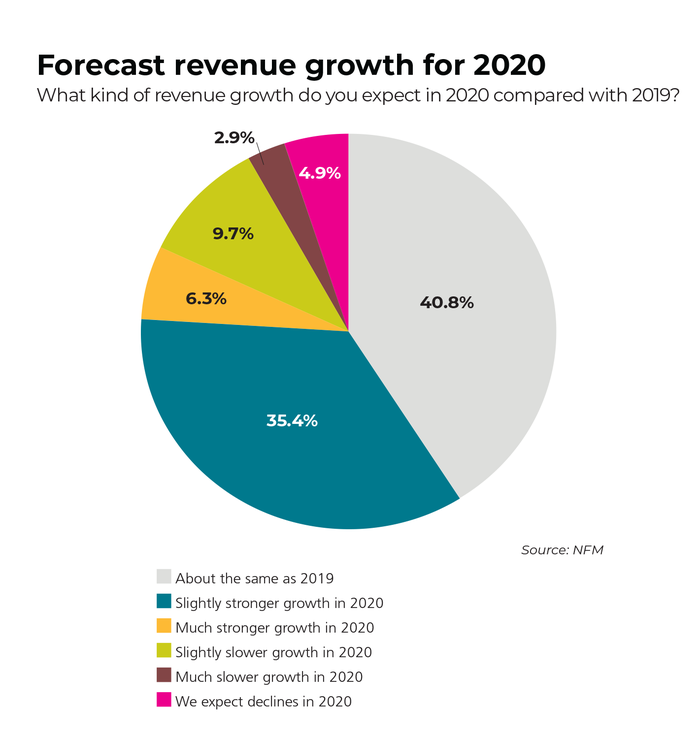
How is natural retail expected to grow in 2020?
Natural products retailers predict their 2020 sales will remain about the same (40.8%) with 35.4% expecting slightly stronger growth.
How much does the average health food store sell each year?
Find sales benchmarking data across natural products retailers below. Traditional health food stores averaged $1.6 million in sales in 2019.
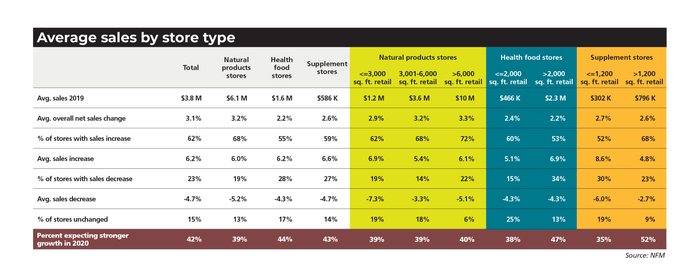 What did growth and competition look like for natural products retailers in 2019?

Natural retail competition continues to grow, with 20% of retailers saying a competitor opened a store in their region.

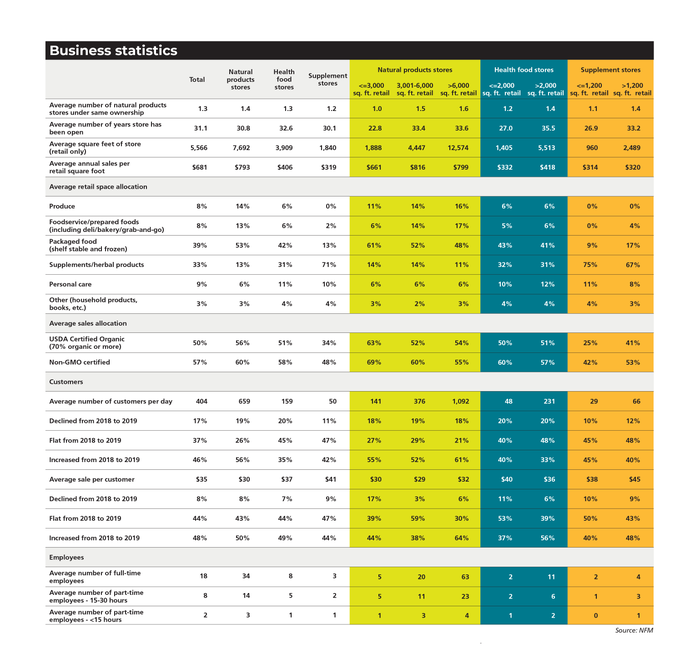
What is the average sales per square foot at natural channel retail?
Below find several important natural retail benchmarks of note.
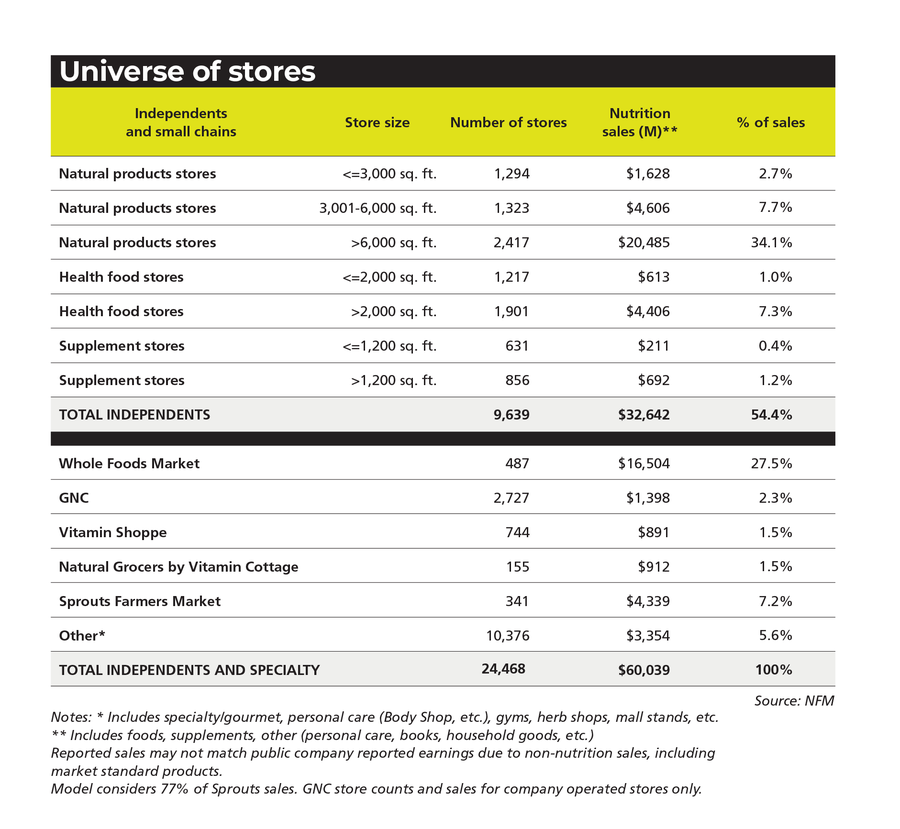
How many natural products retail outlets are there?
The Natural Foods Merchandiser magazine "universe of stores" chart breaks down the number of stores by kind of natural product retail outlet.
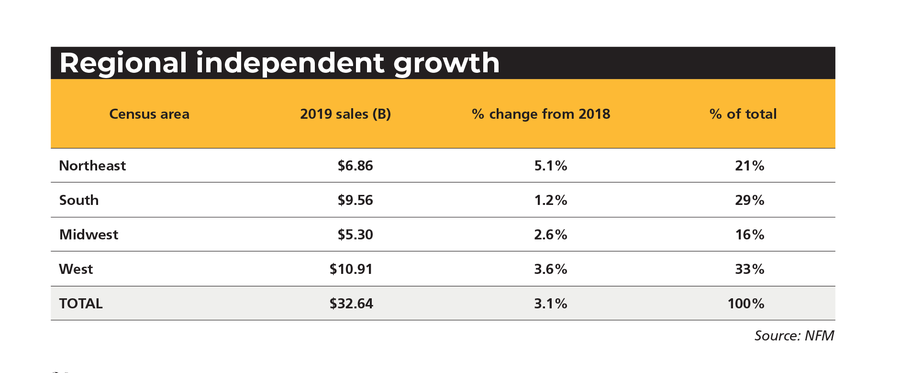
How do natural products sales break down by region?
The below chart shows natural and organic product sales by U.S. Census region.
Natural Foods Merchandiser Market Overview methodology
The 2020 edition of Natural Foods Merchandiser’s Market Overview represents the 40th year the magazine has presented statistics on store operations and the state of the natural products industry. From $1.9 billion in 1980 to $166 billion in 2019, the natural products industry has grown into a multichannel force that has changed food and nutrition.
Just as the numbers vary each year, so does the methodology for collecting, compiling, analyzing and presenting the data. This issue marks the 22nd year NFM has collaborated with Nutrition Business Journal, a New Hope Network sister publication and Informa property, to produce the data.
The inclusion of NBJ data allows for a more complete and robust perspective of the natural products retail industry. The sales contributions of natural and organic foods, dietary supplements and other natural products through such diverse channels as food, drug and mass retailers; multilevel marketing; health care practitioners; mail order; and the internet are also included in the $166 billion natural products industry figure depicted by the pie chart at the top.
Read all of the Natural Foods Merchandiser Market Overview coverage:
The primary vehicle for collecting data for the Market Overview is NFM’s annual natural retail store survey. This survey was distributed to a representative segment of the natural products retail industry, including, but not limited to, natural products stores, health food stores and supplements stores. We asked approximately 45 questions pertaining to store operations. More than 200 respondents from various independent retailers reported the results of their calendar year 2019 operations. While pleased with the results, ultimately the number of respondents completing the survey this year was lower than normal because of the diversion of retailer resources to COVID responses.
Most of the operations data pertains to independent and small-chain retailers divided into three categories by sales mix and eight subcategories by size. This data subset represents 9,639 independent and chain stores.
The $60 billion natural products retail channel is broken down into product category and region, and includes eight store categories plus the biggest chains—Whole Foods Market, GNC, Vitamin Shoppe, Natural Grocers by Vitamin Cottage—and other specialty retailers (specialty/gourmet shops, personal care stores, health clubs, co-ops, herb shops, mall stands, etc.).
Although most of the operating statistics are averaged or aggregated from the responses, estimating total product sales for the entire industry is challenging. Total product category sales and organic sales figures were derived from statistical analysis of survey results in each of the eight natural products retailer categories.
Accurate and complete sales breakdowns were reported by survey respondents. Aggregate sales figures and the percentage of organic were then compiled in each product category; the resulting proportions were applied to the total sales in each category.
For product breakdowns and organic sales information, data from large-chain respondents were incorporated into their appropriate store category. To complete industry sales subtotals from smaller natural product retailers, product sales in all of these store categories were added up. Organic figures were also compared and reconciled against findings from the Organic Trade Association’s 2019 Organic Industry Survey data, also compiled by New Hope Network in the first quarter of 2020.
Data on mass-market sales and other sales channels are derived from several sources. In addition to the NFM survey, retail and consumer sales data is also compiled from NBJ, U.S. government sources, SPINS, IRI (a Chicago-based market research firm), public company financial data, surveys published by other trade publications, and other sources. Data for the mass market and non-retail channels are based on NBJ market estimates.
Not all of the results of the NFM Market Overview survey of 2019 performance and sales are directly comparable with 2018 results printed in the July/August 2019 issue of NFM, as certain adjustments have been made based on the latest available information.
About the Author
You May Also Like


.jpg?width=700&auto=webp&quality=80&disable=upscale)
